Behind the Dashboard: How Rospec Builds Smart Farm Tools
When you log into one of our dashboards, it probably looks simple: a few charts, clean tables, and filters that let you slice the data however you need. But behind every tool we deliver is a deeply custom process that is built specifically for your operation. No two farms are alike, and we do not believe in one-size-fits-all analytics.
At Rospec Insights, our background in agriculture gives us a unique edge. We know the difference between orchard and row-crop economics, we understand how processors structure payments, and we have seen firsthand how weather, labor, and input costs can swing a season. That experience lets us anticipate what farmers want to see, and more importantly, what they need to see before decisions get made in the field.
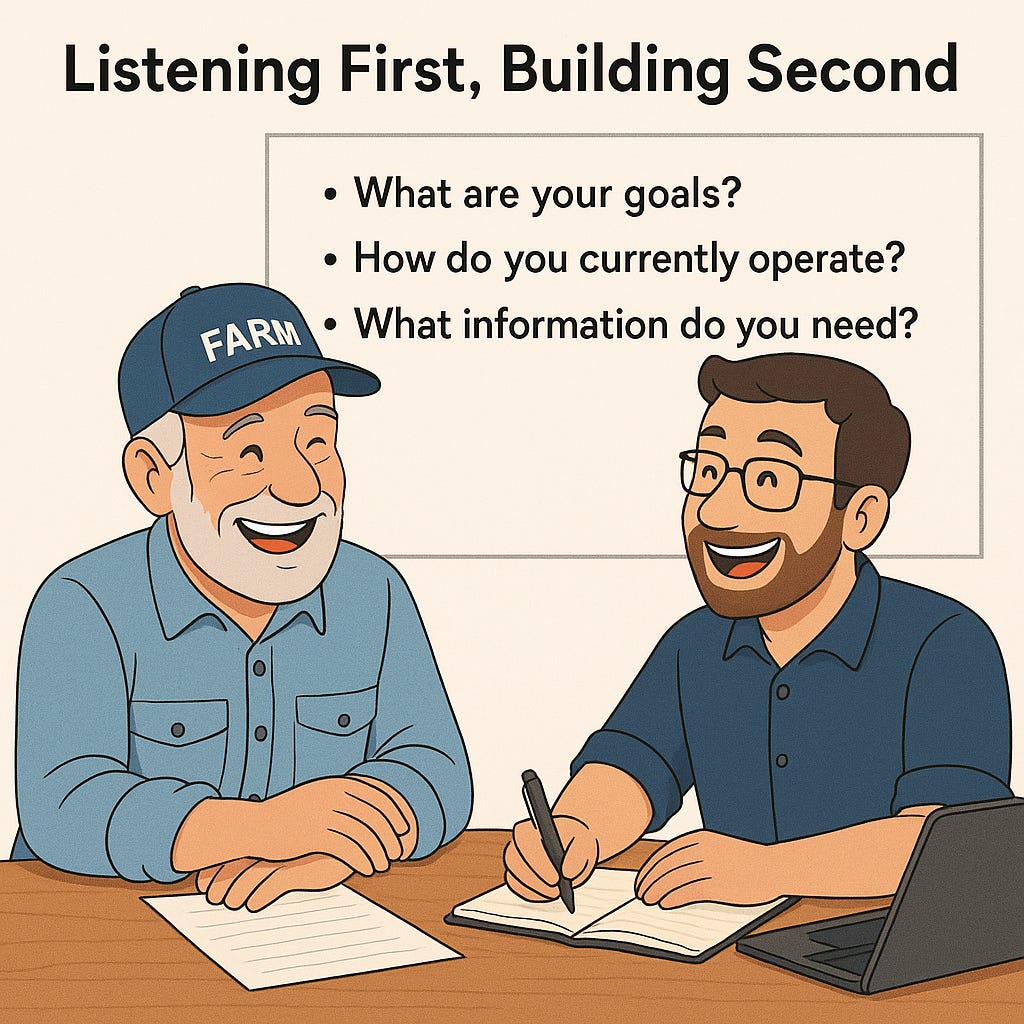
Step 1: Listening First, Building Second
Our process starts with conversations, not code. We ask:
What decisions keep you up at night?
Where are you spending too much time entering numbers instead of farming?
Which reports from your processor, banker, or agronomist frustrate you the most?
By listening closely, we uncover the questions that really drive profitability. A pistachio grower might care about live quality grades during harvest, while a vineyard might need tight cost tracking on labor. Every farm’s needs are different, and that is exactly why we do not build cookie-cutter dashboards.
Step 2: Making Your Data Work for You
Most farms already have plenty of data, it is just scattered. Excel sheets from the office, PDFs from the processor, soil and water lab reports, handwritten field tickets. We specialize in pulling all of it together.
Using a mix of Excel automation, Python data scrapers, and Power BI, we clean and unify the data into one system that updates automatically. This means your “data wrangling” time drops to near zero, and you finally get one trusted source of truth.
Step 3: Custom Design, Not Templates
Here is where the agriculture experience makes the biggest difference. Because we have worked with orchards, vineyards, and row crops, we know what matters in your world. Instead of cluttered screens filled with generic KPIs, we design around your specific operation:
Cost per acre by ranch, field, and variety
Yield comparisons across years with crop-age factored in
Processor statements broken down into easy visuals, so you see exactly where deductions and fees are hitting
Scenario planning tools for budgeting inputs against expected returns
Every chart, table, and calculation is custom-built to mirror the way you actually run your farm.
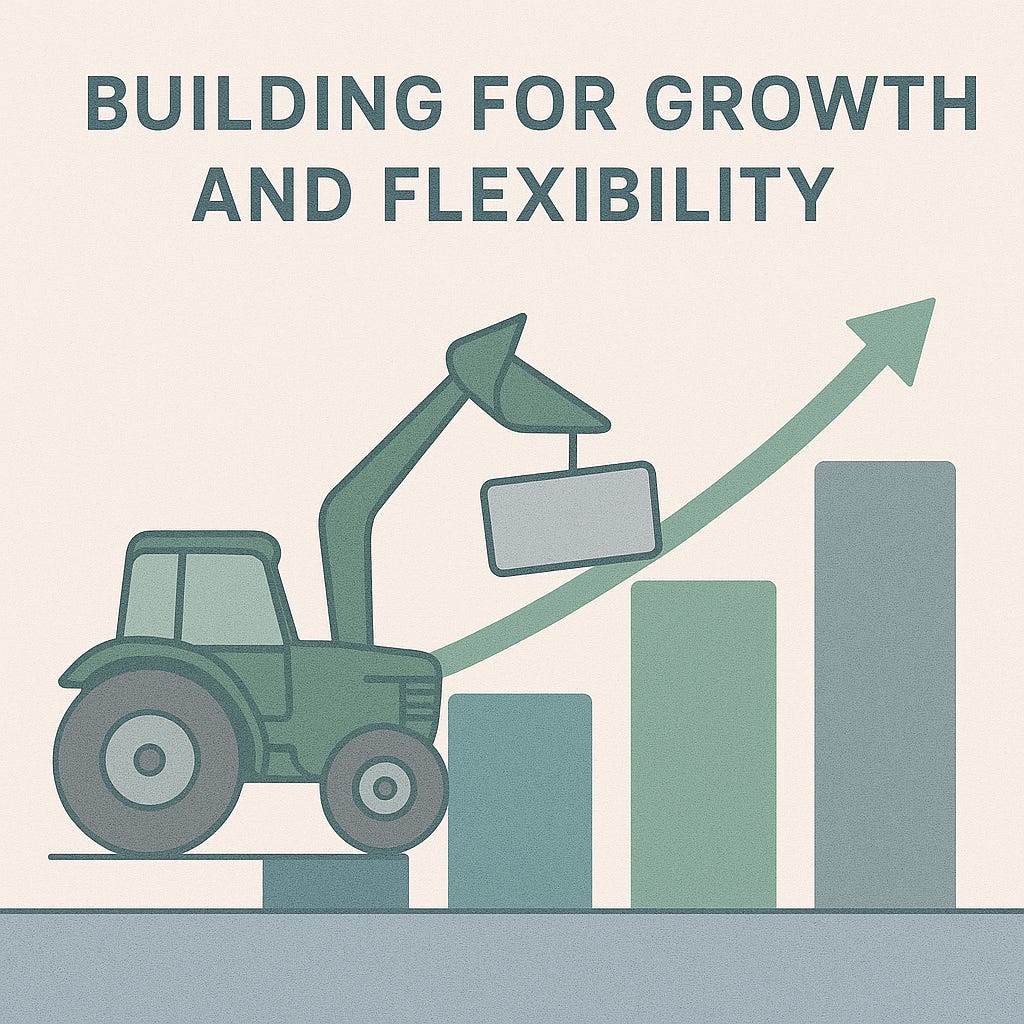
Step 4: Building for Growth and Flexibility
Agriculture never stands still. Neither should your dashboards. We design tools to adapt as your operation grows or changes. Expanding into new crops? Leasing new blocks? Negotiating with a new processor? The dashboard grows with you.
Because our tools are modular, we can add new views and functions without forcing you to start from scratch. That flexibility ensures your investment keeps delivering value year after year.
Step 5: Testing Side by Side with Farmers
We do not just hand over a finished product and walk away. Instead, we sit with growers and ranch managers, walk through the dashboards, and ask:
Does this make sense at a glance?
Is it showing you what you actually need day-to-day?
Is there anything missing?
Farmers tell us what feels intuitive and what does not, and we adjust. That back-and-forth ensures the final product does not just work, it feels natural.
Step 6: Turning Insight into Action
The end goal is not just pretty charts. It is smarter decisions. Our dashboards help farmers:
Spot rising input costs before they eat into margins
Compare processors to see who is returning the best net price
Plan irrigation or fertilizer spend with real data instead of gut alone
Reforecast revenue in real time when actual payments come in
Gut instinct will always matter in farming. But pairing it with clean, clear data gives you the confidence to make the right call when it matters most.
Why This Matters
Technology in farming has too often been built in corporate boardrooms far away from the realities of a field. At Rospec, we do the opposite. Our tools are born in the field, shaped by conversations with growers, and refined with years of ag experience. That is why our dashboards are not just software, they are partnerships designed to make farming smarter, easier, and more profitable.


